
Tencent Holdings (0700.HK): Capital Allocation and Owner Earnings
How Tencent converts accounting profits into owner earnings and free cash flow — and how management allocates that cash across AI investment, share repurchases, dividends, strategic assets, and long-term per-share value creation.

This chapter is Part 4 of the LongViewValue Tencent Research Series. Part 5 will complete the analytical framework with a rigorous valuation of Tencent Holdings — examining intrinsic value through DCF, owner earnings, and relative valuation methods within a scenario-based margin-of-safety framework.
Revenue shows scale. Accounting profit shows reported economics. Free cash flow shows what management can actually allocate — and Owner Earnings help estimate the cash truly available to owners after maintaining competitiveness.
In This Report
This chapter unfolds through five analytical lenses:
→ Why free cash flow is the center of capital allocation analysis
→ How a conservative Owner Earnings proxy reveals Tencent's economic cash generation
→ How Tencent's business model creates favorable working-capital dynamics
→ How management allocates capital across AI, buybacks, and dividends
→ A structured scorecard of Tencent's capital allocation discipline
Introduction: The Buy-Side Focus on Cash
There is a question that separates the serious analyst from the casual observer, and it is deceptively simple: where does the money actually go?
Revenue growth is a headline. Net profit is an accounting construct. But Free Cash Flow (FCF) is the cash that management can actually allocate. It pays for buybacks, funds dividends, finances strategic investments, and ultimately determines whether a business is creating wealth for owners or merely reporting accounting progress.
This is the lens through which long-term investors evaluate capital allocation: not the press release, not the earnings-per-share beat, but the cash that remains after the business has been maintained and strengthened.
When we apply this framework to Tencent Holdings (0700.HK), what emerges is a business that has, over the past decade, demonstrated notable discipline: the ability to generate cash at a rate that often exceeds reported accounting profits, and then deploy that cash across reinvestment, buybacks, dividends, and strategic assets. In 2025, Tencent's operating cash flow reached RMB 303.1 billion against net profit attributable to shareholders of RMB 224.8 billion — a cash conversion ratio of 1.35x. This does not appear to be accidental. It is the structural output of a platform business model that has been optimized for cash generation across multiple economic cycles.
Quality investing, at its core, is partly the discipline of identifying businesses where accounting statements may understate economic earnings power. Tencent is a useful case study in this phenomenon. To understand why, we must begin where Buffett began: with Owner Earnings.
A Conservative Owner Earnings Proxy
Warren Buffett introduced the concept of Owner Earnings in his 1986 letter to Berkshire Hathaway shareholders. His argument was simple but important: reported net income is an accounting construct, not necessarily an economic one. It must be adjusted to estimate what a business can actually earn for its owners after maintaining its competitive position.
The formula Buffett proposed:
Owner Earnings = Net Income + Depreciation & Amortization − Maintenance CAPEX (Capital Expenditures) − Incremental Working Capital Requirements
The logic proceeds in three steps.
Step One: Add back non-cash charges. Depreciation and amortization reduce reported net income, but they do not reduce cash. A software platform that amortizes the cost of a gaming license over three years is not spending that cash again in years two and three — it already spent it in year one. Adding D&A back to net income recovers the cash that accounting convention has temporarily hidden.
Step Two: Subtract maintenance CAPEX. This is the critical discipline that separates Owner Earnings from the cruder metric of EBITDA. A business must continuously reinvest to maintain its competitive position. The factory floor wears out. The server infrastructure ages. The content library depreciates in relevance. The cash required to sustain — not grow, merely sustain — the existing earnings power must be deducted. This is maintenance CAPEX (Capital Expenditures), and it is the number that honest analysts spend the most time estimating.
Step Three: Adjust for working capital changes. If a business must tie up increasing amounts of cash in receivables, inventory, or prepaid expenses simply to sustain its current revenue base, that cash is not available to owners. Conversely, if the business receives cash from customers before it must pay suppliers — a structural float — that negative working capital requirement adds to Owner Earnings.
For Tencent, the exact split between maintenance CAPEX and expansionary CAPEX cannot be observed perfectly from the outside. The table below therefore uses total core CAPEX as a conservative proxy. This is not a perfect Owner Earnings calculation; it is a disciplined approximation designed to avoid overstating the cash available to owners.
Now apply this conservative proxy to Tencent's three-year record:
| YEAR | NET INCOME (RMB BN) |
D&A (RMB BN) |
CORE CAPEX (RMB BN) |
Δ WC (RMB BN) |
OWNER EARNINGS PROXY (RMB BN) |
PROXY / NET INCOME |
|---|---|---|---|---|---|---|
| 2023 | 115.2 | 58.9 | 77.0 | −2.9 | 100.0 | 86.8% |
| 2024 | 194.1 | 56.1 | 77.0 | +2.6 | 170.6 | 87.9% |
| 2025 | 224.8 | 65.8 | 79.2 | −2.5 | 214.0 | 95.2% |
Note: Figures are shown in RMB billions. This table uses a conservative Owner Earnings proxy based on core CAPEX. Negative working-capital changes are treated as cash inflows in the proxy calculation.
The ratio of this conservative Owner Earnings proxy to net income has remained in a tight band of 87% to 95% across three years that included a regulatory trough, a profit recovery, and the onset of a major AI investment cycle. This stability appears structural. It reflects the underlying economics of a platform business that requires relatively modest physical capital to sustain much of its existing earnings power.
Why does this ratio stay so persistently high? The answer lies in the nature of Tencent's core businesses. Gaming, social networking, digital advertising, and financial technology are fundamentally software and platform operations. Once a game title is developed and a gaming license obtained, the marginal cost of serving an additional player approaches zero. Once WeChat's infrastructure is built, the marginal cost of processing an additional message or payment is negligible. The maintenance CAPEX required to sustain these businesses is structurally low relative to the cash they generate.
The 2025 figure of 95.2% deserves particular attention. Under this conservative proxy, for every RMB 100 of net profit Tencent reported, roughly RMB 95 was converted into cash earnings after core capital spending and working-capital adjustment. In the language of quality investing, this is a sign that the accounting profits are not merely accounting profits; they are closely connected to economic cash generation.
One important nuance for the current period: Tencent is in the midst of a significant AI investment cycle. Management has guided for AI-related CAPEX (Capital Expenditures) to more than double in 2026, following RMB 18 billion in AI investment during 2025. Our current estimate is that a meaningful portion of 2025 core CAPEX was AI-related incremental spending. If one treats this AI investment as expansionary rather than maintenance capital — a reasonable assumption, since the existing gaming and advertising businesses would sustain their competitive positions without it — then the underlying Owner Earnings of the mature core franchise may be higher than the conservative proxy suggests. The 87%-95% ratio, in other words, should be understood as a conservative analytical floor rather than a precise ceiling for the core franchise.
The Structural Float of Negative Working Capital
Charlie Munger once observed that the most dangerous words in investing are "it's different this time." But there is a corollary that is equally important: when something genuinely is structurally different about a business model, the analyst who fails to recognize it may systematically misread the economics.
Tencent's working capital dynamics represent one of those genuine structural differences.
In a conventional business — a manufacturer, a retailer, a distributor — working capital is a cost. The company must pay for raw materials before it sells finished goods. It must extend credit to customers before it collects cash. It must maintain inventory buffers against demand uncertainty. All of this ties up capital that earns nothing while it waits. As the business grows, it must continuously inject more cash into this working capital pool simply to sustain its revenue base. Working capital is a tax on growth.
Parts of Tencent's model invert this pattern.
Consider the mechanics of several of Tencent's primary revenue streams:
Gaming: A player purchases virtual currency or a game item. The cash arrives in Tencent's account immediately. The obligation to deliver the virtual good or service is fulfilled at negligible marginal cost, often instantaneously. The customer has, in effect, pre-funded Tencent's operations.
Advertising: Advertisers commit budgets and prepay for inventory. Tencent collects the cash, then delivers the impressions over the contracted period. Again, cash arrives before the service obligation is fulfilled.
Subscriptions and memberships: Monthly or annual subscription fees for video content, music, and cloud storage are collected upfront. The content delivery cost is spread over the subscription period.
WeChat Pay and financial technology: Transaction economics differ by product and regulatory arrangement, but fee income is generally tied closely to transaction flow rather than a long receivables cycle.
The aggregate effect of these payment structures is favorable working-capital timing. In parts of the business, customers and ecosystem participants effectively help finance Tencent's operating cycle before or near service delivery. This is not insurance float in the Berkshire sense, but it is an important form of working-capital float.
The data supports this dynamic. In 2023, the change in working capital contributed RMB 28.9 billion to Owner Earnings — meaning the business generated cash in excess of its net income partly because customers were funding its operations. In 2025, the working capital contribution was again positive at RMB 25.1 billion. Even in 2024, when working capital was a modest drag of RMB 25.5 billion, the overall Owner Earnings ratio remained above 87%.
To appreciate the importance of this structure, consider the alternative. A business with the same revenue and profit profile as Tencent, but with conventional working capital dynamics — say, 60-day receivables and 30-day payables — would need to tie up billions of additional capital simply to sustain its operations. That capital would need to be financed, either through debt (at a cost) or equity (diluting existing shareholders). Tencent faces far less of this burden in several of its core platform businesses. In this narrower but important sense, its ecosystem helps finance part of the operating cycle.
This favorable working-capital structure also has a secondary effect. Cash held before or around service delivery is not necessarily idle — it can earn a return. In 2025, Tencent's interest income reached RMB 16.9 billion, implying an effective yield of approximately 4.1% on its average broad monetary assets of roughly RMB 416.1 billion. This is meaningfully above Chinese benchmark deposit rates, reflecting active treasury management across structured deposits, money market instruments, and short-term financial products. The working-capital advantage, in other words, can be not merely low-cost but also interest-generating in certain periods.
The management of this float is itself a form of capital allocation. By maintaining RMB 433.8 billion in broad monetary assets while paying an effective borrowing rate of approximately 3.95% on RMB 406.4 billion of interest-bearing debt, Tencent has constructed a balance sheet where the cost of its liabilities is nearly offset by the yield on its liquid assets. The net cash position of RMB 27.4 billion understates the quality of this balance sheet — what matters is not the net figure but the structure: long-duration, low-cost debt on one side; high-quality, actively managed liquid assets on the other.
This is not merely a cash-rich balance sheet. It is a balance sheet that appears to have been actively managed as part of the capital allocation system.
The discussion so far has established the source of Tencent’s capital allocation power: strong cash conversion, substantial owner earnings, and a favorable working-capital structure.
The next question is what management does with that cash.
The framework below summarizes how Tencent’s core business cash engine is translated into reinvestment, shareholder returns, balance-sheet resilience, and ultimately per-share intrinsic value growth.
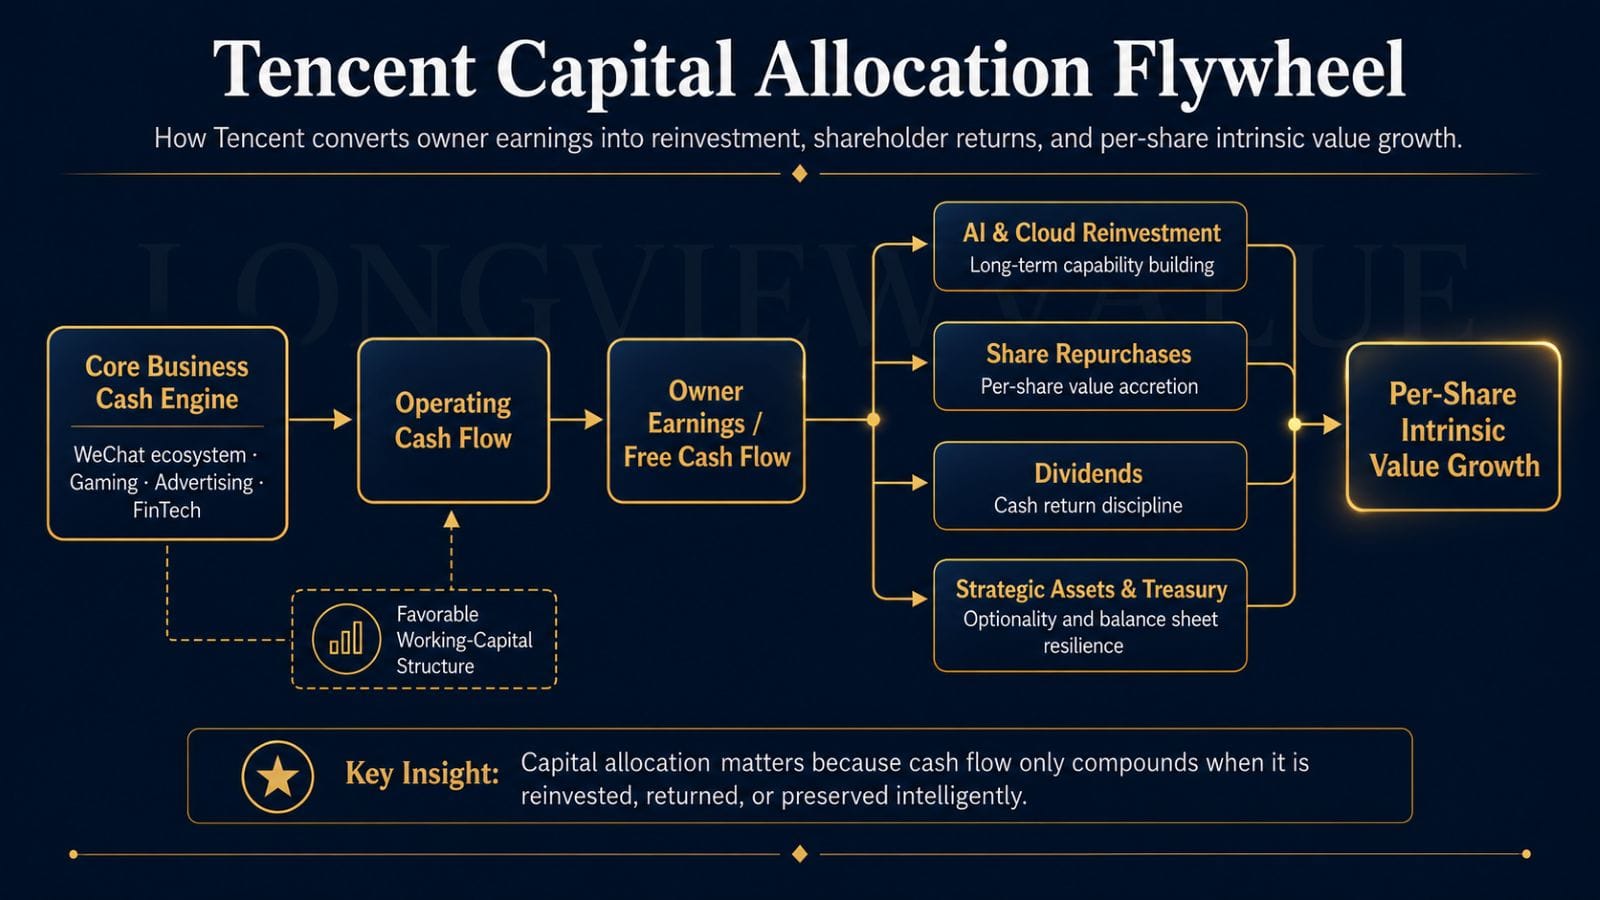
This framework helps clarify why Tencent’s capital allocation deserves close study.
The investment case does not depend only on whether Tencent generates cash. It depends on whether that cash is reinvested, returned, or preserved in ways that increase long-term per-share value.
That is the lens through which the following sections evaluate AI investment, buybacks, dividends, and balance-sheet decisions.
Balance Sheet Optimization: Buybacks, Portfolio, and Dividends
The true test of a management team's capital allocation discipline is not what it says in earnings calls. It is what it does with cash when no one is forcing its hand.
Tencent's management has, over the past several years, demonstrated a capital allocation framework that is coherent and measurable. It operates across three distinct channels: strategic reinvestment, share repurchases, and dividends. Understanding how management balances these three channels — and why the current weighting is structured as it is — is essential to evaluating Tencent as a long-term compounding vehicle.
The Reinvestment Imperative: AI and the Expanding CAPEX Cycle
The most consequential capital allocation decision Tencent's management is currently making is the commitment to dramatically accelerate AI investment. In 2025, AI-related spending reached RMB 18 billion. Management has guided for this figure to more than double in 2026, with total CAPEX expected to increase substantially, particularly in the second half of the year.
"We expect to more than double investments in New AI Products in 2026... you should expect a substantial increase in capex, especially in the second half of this year."
— Tencent Holdings Q1 2026 Earnings Call, May 13, 2026
This is a significant commitment. But it must be evaluated in the context of Tencent's Free Cash Flow (FCF) generation capacity. In 2025, Tencent generated RMB 182.6 billion in FCF against operating cash flow of RMB 303.1 billion — a conversion rate that reflects both the capital requirements of the core platform and the expanding AI infrastructure build-out. (Note: CAPEX figures in this report reflect two distinct analytical methodologies. The Owner Earnings table uses RMB 79.2 billion, representing core PPE-focused capital expenditures. The broader figure of RMB 112.9 billion includes lease obligations and other capital commitments. FCF of RMB 182.6 billion represents management's reported free cash flow after all capital obligations.) The core business generates sufficient cash to fund the AI investment cycle without impairing shareholder returns through dilution or balance sheet deterioration. This is the financial foundation that makes Tencent's AI investment cycle different from a cash-burning speculative venture: the investment is being funded by the cash-generative power of the existing franchise.
The investment portfolio — valued at approximately RMB 913.8 billion as of year-end 2025 — represents another dimension of Tencent's capital allocation strategy. This portfolio, accumulated over years of strategic minority investments in gaming, fintech, enterprise software, and consumer internet companies globally, functions as both a strategic option and a potential source of latent value. The current analysis applies a conservative 50% discount to this portfolio in the DCF valuation, yielding a contribution of RMB 456.9 billion to the equity value calculation. Even at this haircut, the portfolio represents a meaningful component of intrinsic value that is not captured in earnings-based metrics.
The Buyback Program: Capital Allocation at Its Most Disciplined
The clearest expression of management's current capital allocation philosophy is the share repurchase program. In 2025, Tencent repurchased approximately RMB 73.4 billion of its own shares. This figure is substantially above the total cash dividend paid in the same year (approximately RMB 41.9 billion, or HKD 48.3 billion). The ratio is not accidental — it reflects a deliberate and analytically sound judgment about the most efficient use of shareholder capital.
The logic is straightforward:
First, the valuation argument. At a Price-to-Book ratio of approximately 3.24x — against a ten-year median of approximately 6.5x — Tencent's repurchases have been executed at valuations below its own historical trading range. PB is not a sufficient valuation tool for an asset-light platform business, but it is a useful historical reference point when combined with free-cash-flow yield, owner-earnings power, and intrinsic-value analysis. Each cancellation increases the per-share claim of remaining shareholders on the company's earnings, cash flows, and net assets. This is not financial engineering; it is arithmetic.
Second, the tax efficiency argument. Cash dividends paid to mainland Chinese investors holding Tencent through the Stock Connect program are subject to a 20% withholding tax at the point of distribution. Buybacks, by contrast, deliver value through share price appreciation, which is not taxed until the investor chooses to realize the gain. For long-term holders, the present value of this tax deferral is material.
Third, the signaling argument. A management team that commits RMB 73.4 billion of real cash to repurchasing its own shares is making the most credible possible statement about its assessment of intrinsic value. Words are cheap; capital is not. The cumulative buyback program of over RMB 170 billion across 2024 and 2025 represents a very large repurchase commitment by Asian-market standards, and it has been executed at valuations that, by Tencent's own historical range, appear to offer a notable margin of safety.
Fourth, the strategic flexibility argument. By maintaining a higher proportion of shareholder returns through buybacks rather than dividends, management preserves the ability to redirect cash toward AI investment, strategic acquisitions, or accelerated repurchases if the share price declines further. Dividends, once established at a given level, create an implicit commitment that constrains future flexibility. Buybacks do not.
The dividend program, while secondary to buybacks in the current capital allocation hierarchy, is nonetheless growing at a meaningful rate. Per-share cash dividends have increased from HKD 2.40 in 2022 to HKD 5.30 in 2025 — a compound annual growth rate that reflects management's confidence in the durability of the underlying cash generation. The payout ratio of approximately 19.8% in 2025 leaves substantial room for continued dividend growth as the AI investment cycle matures and FCF expands.
The Balance Sheet as a Strategic Asset
Tencent's balance sheet, properly understood, is not merely a financial statement — it is a strategic weapon. Total assets of RMB 2,039.0 billion, an interest-bearing debt ratio of 19.9%, and operating cash flow that covered net income by 1.35x in 2025 collectively describe a balance sheet capable of funding a major technology transition without obvious financial strain.
The ROCE (Return on Capital Employed) of 74.2% in 2025 — derived from EBIT of RMB 263.7 billion against employed capital of RMB 355.6 billion — is one of the strongest summary statistics of Tencent's capital efficiency. A business that generates RMB 74.20 of operating profit for every RMB 100 of capital employed is, by definition, a business that does not need much capital to sustain its competitive position. This is the mathematical foundation of a compounding machine: high returns on capital, combined with disciplined reinvestment and rational shareholder returns, can produce growth in per-share intrinsic value over time.
Final Verdict: The Capital Allocation Scorecard
The following scorecard synthesizes the analytical framework developed across this chapter into a structured assessment of Tencent management's capital allocation discipline. Each dimension is scored on a 1-10 scale, with 10 representing the strongest capital-allocation performance observed among global technology platforms. Scores reflect the author's personal analytical judgment based on publicly available information and should not be construed as investment advice or a securities recommendation.
Tencent Management Capital Allocation Scorecard
Owner Earnings Quality
Conservative Owner Earnings proxy remained between 87% and 95% of net income across 2023–2025, including a regulatory trough, profit recovery, and the beginning of a major AI investment cycle.
If AI infrastructure becomes recurring maintenance capital rather than expansionary investment, the Owner Earnings ratio may compress.
Working-Capital Structure
Tencent’s platform model creates favorable working-capital dynamics across gaming, advertising, subscriptions, and parts of its fintech ecosystem, supporting strong cash conversion.
Regulatory changes to payment settlement, prepayment structures, or platform economics could reduce this working-capital advantage.
Free Cash Flow Generation
2025 FCF of RMB 182.6 billion and operating cash flow of RMB 303.1 billion reflect strong cash conversion and substantial funding capacity for AI investment, buybacks, and dividends.
AI CAPEX growth in 2026–2027 may pressure near-term FCF and make future cash conversion more cyclical.
Share Repurchase Execution
Tencent repurchased RMB 73.4 billion of shares in 2025 and more than RMB 170 billion across 2024–2025, with buybacks executed during a period of historically lower valuation multiples and strong cash generation.
The pace of repurchases may slow if AI investment absorbs a larger share of FCF, or if intrinsic value estimates prove too optimistic.
Dividend Policy Coherence
Per-share dividend increased from HKD 2.40 in 2022 to HKD 5.30 in 2025, while the payout ratio of approximately 19.8% leaves room for continued growth.
The dividend yield remains modest in absolute terms, and income-oriented investors may find the total cash yield insufficient without continued buyback execution.
Strategic Reinvestment Discipline
AI investment of RMB 18 billion in 2025 was funded from operating cash flow without visible balance sheet deterioration, while the investment portfolio remains a meaningful source of strategic optionality.
AI investment doubling in 2026 carries execution risk, and historical minority investments have included write-downs that affected reported earnings.
Balance Sheet Management
Interest-bearing debt ratio of 19.9%, an effective borrowing rate of approximately 3.95%, and liquid-asset yields near 4.1% suggest active treasury management. ROCE of 74.2% reflects high capital efficiency.
Net cash remains modest relative to Tencent’s market capitalization, and balance sheet optionality is partly tied to the investment portfolio and AI infrastructure cycle.
Capital Allocation Communication
Management provides specific quantitative guidance on AI investment, CAPEX trajectory, and trade-offs between reinvestment and shareholder returns.
Timelines for AI monetization remain deliberately vague, and investors still lack full visibility into the release and adoption path of WeChat AI Agent products.
ROCE Sustainability
ROCE of 74.2% in 2025 reflects the structural advantage of a platform business with limited physical capital requirements, while ROE recovered from 14.5% in 2023 to 21.1% in 2025.
Sustained AI CAPEX may increase the capital base and normalize ROCE if AI infrastructure becomes a permanent cost of competition.
Long-Term Value Creation Track Record
Tencent generated a net income CAGR of 20.7% over 2016–2025 with no loss years, and 2025 net income of RMB 224.8 billion represented a new historical high.
Past compounding does not guarantee future results. The transition from a high-growth internet platform to an AI-era infrastructure company involves genuine strategic uncertainty.
Composite Score: 8.7 / 10
Weighted average with elevated weighting on Owner Earnings quality, Free Cash Flow generation, and ROCE sustainability as the three dimensions most relevant to long-term compounding.
Scorecard Interpretation
The composite score of 8.7/10 places Tencent's capital allocation framework in a strong category among global technology platforms. The score reflects genuine structural advantages: a business model that generates cash in excess of accounting profits, a working capital structure that functions as an interest-generating float, a repurchase program executed at valuations that present a notable margin of safety based on historical valuation percentiles, and a management team whose communication has become increasingly quantitative and strategically coherent.
The primary deductions reflect two legitimate concerns. First, the AI investment cycle introduces genuine uncertainty about the future trajectory of FCF and ROCE. Management has committed to more than doubling AI investment in 2026, and the financial returns on this commitment will not be visible in the income statement for several years. Second, the net cash position of RMB 27.4 billion — modest relative to the scale of the enterprise — reflects a deliberate choice to deploy capital into the investment portfolio and AI infrastructure rather than accumulate a Berkshire-style cash fortress. This is a defensible choice, but it does reduce the balance sheet optionality available to management in a stress scenario.
What the scorecard cannot fully capture — and what will ultimately determine whether Tencent's next stage of capital allocation creates substantial value — is the quality of the AI investment decision itself. The financial discipline is visible. The strategic judgment will be rendered by future cash flows.
This chapter is Part 4 of the LongViewValue Tencent Hub Series. Part 5 will complete the analytical framework with a rigorous valuation of Tencent Holdings — examining intrinsic value through DCF, owner earnings yield, and relative multiple analysis to arrive at a price-based margin of safety assessment.
Tencent Research Hub
This article is Part 4 of the LongViewValue Tencent Research Series.
Published
✓ Part 3: AI Strategy, Value Capture, and the Agent Era
✓ Part 4: Capital Allocation and Owner Earnings — Current article
Coming Next
→ Part 5: Valuation and Margin of Safety
← Back to Tencent Research Hub
Disclosure & Disclaimer
This article is a personal research note for educational and informational purposes only, based on publicly available information. It does not constitute investment advice, securities recommendation, or a solicitation to buy or sell any security.
The author is not a licensed securities analyst or registered investment adviser. All analyses, valuations, scores, and opinions are the author’s personal views and may contain errors or omissions.
Readers should conduct their own independent research and consult licensed professionals before making investment decisions. Investing involves risk, including the risk of permanent capital loss. Past performance does not guarantee future results.
The author may hold positions in the securities discussed.