
Tencent Holdings (0700.HK): Valuation and Margin of Safety
The final chapter of LongViewValue’s Tencent research series examines intrinsic value and margin of safety through P/B, SOTP, DCF, and owner earnings, with explicit assumptions and valuation scenarios.

Anchoring Tencent’s intrinsic value across P/B, SOTP, DCF, and owner earnings.
This is Part 5 — and the conclusion — of the LongViewValue Tencent Research Series, following the Investment Thesis, Economic Moat, AI Strategy, and Capital Allocation chapters.
Valuation is strongest when different methods disagree on inputs, but still point in the same direction.
In This Report
This chapter unfolds through five sections:
→ The P/B floor: where asset backing and ROE set the starting point
→ SOTP: disaggregating Tencent’s five distinct value pools
→ DCF scenario matrix: stress-testing the core business across 25 parameter combinations
→ Balance sheet cross-verification: treasury spread and ROCE
→ Conclusion: four methods, one direction
Introduction: Anchoring Intrinsic Value
There is a particular discipline that separates rigorous long-term investors from the broader market: the refusal to confuse price with value.
Price is what the market prints. Value is what a business is worth under conservative assumptions about future cash generation, capital intensity, competitive durability, and risk.
"Price is what you pay. Value is what you get." — Warren Buffett
For a business as complex as Tencent, the gap between price and value is rarely explained by a single metric. Tencent is not only a gaming company, not only a social platform, not only a payments network, and not only an AI option. It is a collection of cash-generating businesses, strategic assets, reinvestment opportunities, and long-duration optionality.
This chapter is dedicated to valuation, but it does not rely on one model. We use four independent methods, each asking a different question:
- Price-to-Book (P/B) as a valuation floor — what does Tencent’s asset base and ROE imply about downside support?
- SOTP valuation — what are the major value pools worth when separated from the consolidated entity?
- DCF scenario matrix — what is the present value of Tencent’s core operating cash flows under varying discount-rate and terminal-growth assumptions?
- Balance sheet and owner earnings cross-check — does cash conversion and treasury structure support the valuation base?
The purpose is not to produce a single precise price target. The purpose is to test whether different valuation methods point toward a similar range under conservative assumptions.
The empirical foundation is Tencent’s decade-long record of profitability. From 2016 to 2025, Tencent did not record a single annual loss in net profit attributable to shareholders. Net income compounded at a substantial rate through regulatory tightening, gaming-license freezes, investment write-downs, and a major business-model transition. The trough year of 2023 still produced RMB 115.2 billion in net profit attributable to shareholders. By 2025, net profit had recovered to RMB 224.8 billion, a new historical high.
A business with that earnings trajectory, trading near the lower end of its decade-long P/B band, deserves first-principles analysis rather than either casual dismissal or automatic optimism.
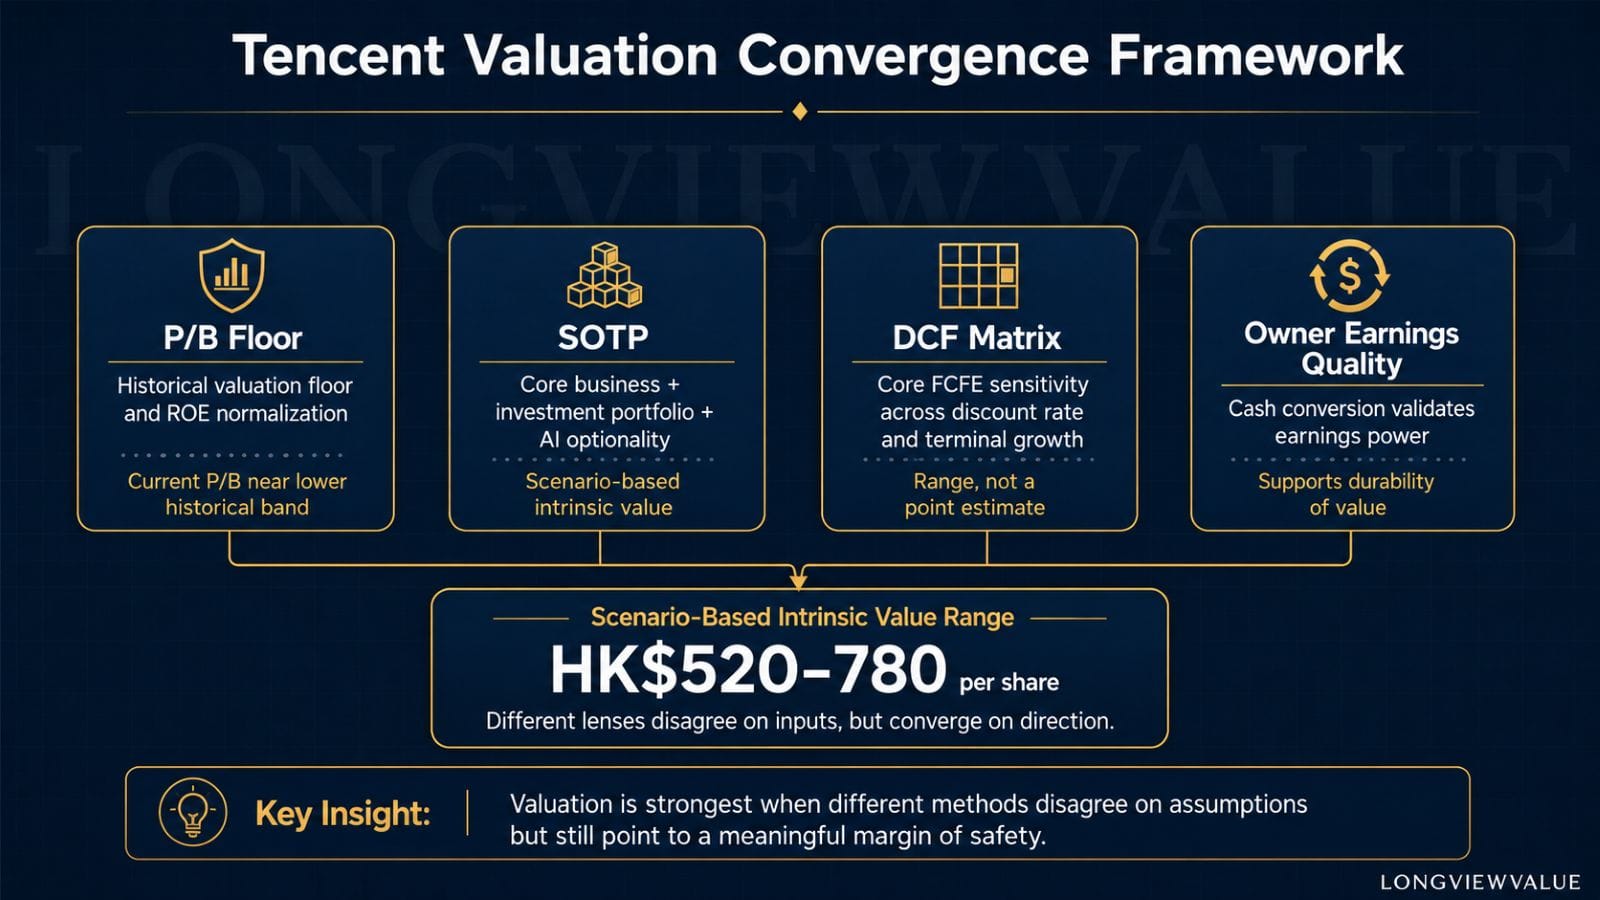
A LongViewValue framework showing how P/B, SOTP, DCF, and owner earnings quality converge into a scenario-based intrinsic value range rather than a single point estimate.
Price-to-Book (P/B) Multiple as a Valuation Floor
The Relationship Between P/B and ROE
Before looking at Tencent’s historical P/B band, it is useful to establish why the P/B ratio matters at all.
Under a clean-surplus framework, a simplified Gordon-style relationship links price-to-book, ROE, growth, and cost of equity:
Where:
- ROE = return on equity;
- g = sustainable long-term growth rate;
- r = required rate of return, or cost of equity.
The formula is not a mechanical trading rule. It is a useful anchor. A business deserves to trade above book value when its ROE sustainably exceeds its cost of equity. Conversely, a low P/B multiple for a high-ROE business may imply that the market expects ROE deterioration, a higher risk premium, lower growth, or some combination of all three.
Tencent’s 2025 ROE was approximately 21.1%, recovering from a trough of 14.5% in 2023 and sustaining above 20% for two consecutive years. If we assume a 9% cost of equity and a 3% long-term growth rate, the formula implies a justified P/B of roughly 3.0× as a conservative floor. As the sustainable growth assumption moves toward 5%–7%, the implied P/B rises materially.
Tencent’s current market P/B is approximately 3.24×, near the 10th–15th percentile of the past decade. One interpretation is that the market is pricing Tencent as if its ROE will structurally move closer to its cost of equity, or as if the required risk premium has permanently increased.
That interpretation may be defensible if an investor assumes persistent geopolitical risk, VIE-structure discount, regulatory risk, or AI-related capital intensity. But it is not the only possible interpretation. The recent financial record — ROE above 20%, FCF of RMB 182.6 billion in 2025, and normalized gaming approvals — suggests that the business has not yet behaved like a company whose ROE is collapsing toward its cost of equity.
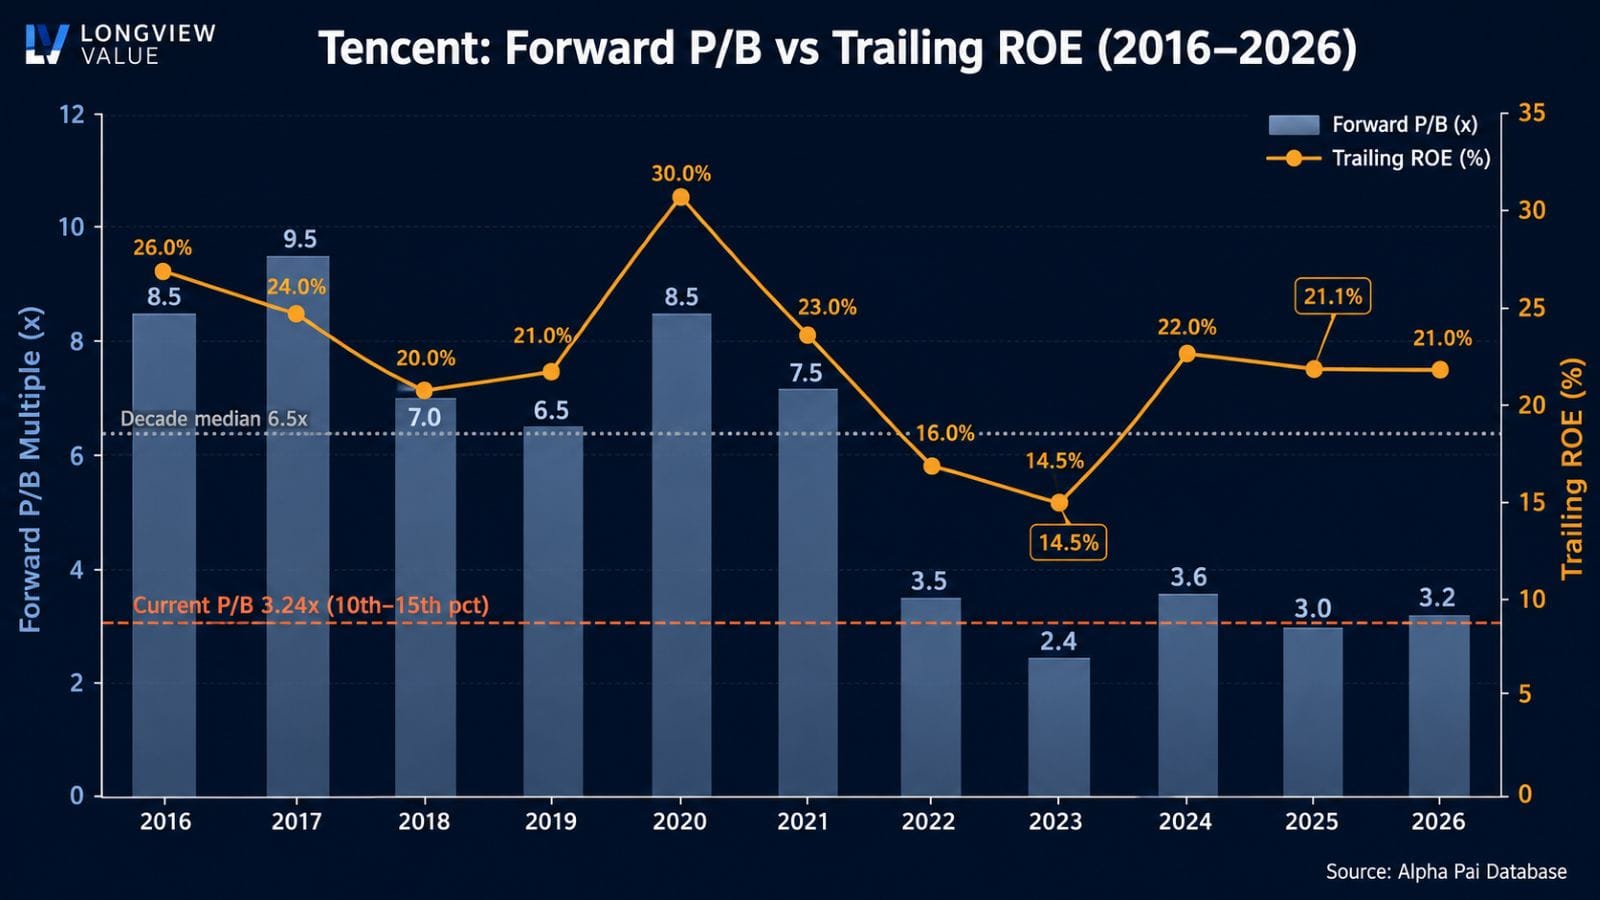
Tencent’s forward P/B multiple remains near the lower historical band even after ROE recovered above 20%.
The Historical P/B Band in Five Phases
Tencent’s decade-long P/B band can be divided into five broad phases:
| Period | P/B Range | Structural Context |
|---|---|---|
| 2017–Early 2018 | 8×–10×+ | Peak mobile internet growth premium; market pricing in perpetual hypergrowth. |
| Mid-2018–2019 | 6×–8× | Gaming-license freeze and US-China trade friction; first major de-rating cycle. |
| 2020–Early 2021 | 8×–10× | Pandemic-era digital acceleration and global liquidity expansion. |
| Mid-2021–Early 2024 | 2.4×–4× | Antitrust pressure, gaming-license uncertainty, investment write-downs, and elevated geopolitical risk; decade-low valuation band. |
| Mid-2024–Present | 3×–4× | Regulatory normalization, earnings recovery, and accelerated buyback execution. |
The current P/B of approximately 3.24× sits closer to the lower bound than the midpoint. The decade median is approximately 6.5×, while the decade low was around 2.4×, reached when regulatory pressure, gaming-license uncertainty, and geopolitical risk were simultaneously elevated.
The present fundamental backdrop is materially different from that trough: ROE has recovered above 20%, gaming licenses have normalized, FCF reached RMB 182.6 billion in 2025, and buybacks have accelerated. That does not eliminate risk, but it does make the current P/B band analytically important.
A conservative recovery to 4× book value implies a per-share value of approximately HK$560, based on a book value per share of roughly HK$140. A recovery to the decade median of 6.5× implies approximately HK$910. These are not forecasts. They are valuation reference points showing how much of the current market price is being shaped by a depressed P/B multiple.
Sum-of-the-Parts (SOTP) Framework
Disaggregating Tencent’s Value Pools
Tencent is not a single business. It is a portfolio of structurally different economic engines, each with its own growth profile, competitive position, and valuation method.
A consolidated P/E or EV/EBITDA multiple can obscure this structure. The SOTP framework tries to separate Tencent into major value pools and value each under its own assumptions.
The five primary value pools are:
1. Core Gaming: Domestic and International
Tencent’s gaming business remains one of the largest and most profitable gaming franchises globally. Domestic gaming benefits from the normalization of license issuance after the regulatory trough, while international gaming — including Riot Games, Supercell, and minority stakes — provides geographic diversification.
The segment has high operating leverage, strong IP, and relatively low incremental capital intensity once titles and infrastructure are established. A conservative normalized earnings multiple is appropriate given China regulatory risk, but the business remains a major anchor of Tencent’s intrinsic value.
2. Online Advertising: WeChat Ecosystem and Video Accounts
Tencent’s advertising business benefits from WeChat distribution, AI-enhanced targeting, and Video Accounts monetization.
The key analytical point is that Video Accounts still appears under-monetized relative to the broader short-video industry. Management has discussed a relatively low ad-load structure, leaving a potential multi-year monetization runway. The valuation question is not whether advertising grows forever at high rates, but whether the platform can gradually increase monetization while preserving user experience.
3. FinTech and Business Services: WeChat Pay and Cloud
This segment contains two different businesses.
WeChat Pay is mature, high-frequency infrastructure embedded in daily transactions. Tencent Cloud has moved from a cost center toward a more disciplined, profit-oriented business, with AI cloud services adding a new growth vector.
The segment should not be valued as a single homogeneous unit. Payments infrastructure, cloud services, and enterprise software have different margins, capital intensity, and regulatory sensitivities. But collectively, they represent a meaningful value pool beyond gaming and advertising.
4. Investment Portfolio
Tencent’s investment portfolio carried a balance sheet value of approximately RMB 913.8 billion as of year-end 2025.
For valuation purposes, we apply a 50% discount to the portfolio value to reflect illiquidity, concentration, market volatility, strategic constraints, and the practical difficulty of realizing full value quickly. This produces a conservative contribution of approximately RMB 456.9 billion.
This haircut is intentionally conservative. The portfolio may be worth more over time, but a margin-of-safety valuation should not assume full and immediate realization.
5. AI Optionality: Hunyuan and WeChat Agent Ecosystem
AI is the most difficult component to value.
Tencent has the ingredients for a differentiated AI distribution and execution layer: Hunyuan models, WeChat’s social graph, mini-programs as a tool library, payments infrastructure, and cloud services. But the monetization timeline remains uncertain.
For that reason, this framework treats AI as scenario-based optionality rather than a fully proven operating value pool. In the conservative case, we assign no explicit value to AI optionality. In the base and optimistic cases, we assign value only as a probabilistic option, not as guaranteed earnings.
Assumption Notes
The SOTP table below relies on four key assumptions:
- Core business value is derived from normalized earnings and FCF multiples across Tencent’s major operating segments.
- The investment portfolio is valued with a 50% haircut to balance-sheet carrying value.
- AI option value is scenario-based, not treated as part of current operating earnings.
- Per-share values assume approximately 9.037 billion shares and an RMB/HKD exchange-rate assumption of 0.92.
Scenario-Based SOTP Summary
| Scenario | Core Business Value | Adjustments / Optionality | Total Equity Value | Per Share |
|---|---|---|---|---|
| Conservative | RMB 4.2T |
Investment portfolio: RMB 457bn after 50% discount AI option value: RMB 0 |
~RMB 4.66T | ~HK$570 |
| Base Case | RMB 4.9T |
Investment portfolio: RMB 457bn after 50% discount AI option value: RMB 500bn |
~RMB 5.86T | ~HK$715 |
| Optimistic | RMB 6.5T |
Investment portfolio: RMB 457bn after 50% discount AI option value: RMB 1.5T |
~RMB 8.46T | ~HK$1,030 |
Complementary DCF Scenario Matrix
Isolating Core Business Intrinsic Value
DCF is useful because it asks a different question from P/B and SOTP:
What is the present value of Tencent’s core operating cash flows, independent of the investment portfolio and without assigning explicit value to AI monetization?
This is a conservative framing. It does not require AI to become a major standalone profit pool. It asks whether Tencent’s existing operating businesses can support a valuation materially above the reference market price.
The model is structured as a two-stage FCFE discount.
Key Assumptions
Reported 2025 FCF: Tencent generated approximately RMB 182.6 billion of reported FCF in 2025.
Core-business FCFE proxy: For the DCF, we start from operating cash flow of RMB 303.1 billion and total CAPEX of RMB 112.9 billion. We then add back an estimated RMB 36.0 billion of AI-related incremental CAPEX, treating it as expansionary rather than maintenance capital for the core business. This produces a core-business FCFE proxy of approximately RMB 226.0 billion.
This is an analytical proxy, not a management-reported figure. The distinction matters: if AI infrastructure becomes recurring maintenance capital rather than expansionary investment, the appropriate FCFE base would be lower.
Growth assumptions:
- 2026E–2028E: 10% per year, reflecting continued growth in gaming, advertising, FinTech, and cloud, excluding explicit AI monetization.
- 2029E–2030E: 7% per year, reflecting natural deceleration as core businesses mature.
- Terminal growth: 3%, modestly above long-term nominal growth assumptions and reflecting some platform-level pricing power.
Discount rate: 9%, reflecting a China/Hong Kong equity risk framework with an additional premium for geopolitical, regulatory, and VIE-structure risk. The appropriate discount rate is uncertain, which is why the sensitivity matrix below is more important than any single point estimate.
FCFE Discount Schedule
| Year | Growth Rate | Core FCFE (RMB bn) |
Discount Factor (9%) |
Present Value (RMB bn) |
|---|---|---|---|---|
| 2026E | 10% | 248.6 | 0.917 | 228.1 |
| 2027E | 10% | 273.5 | 0.842 | 230.2 |
| 2028E | 10% | 300.8 | 0.772 | 232.3 |
| 2029E | 7% | 321.9 | 0.708 | 228.0 |
| 2030E | 7% | 344.4 | 0.650 | 223.8 |
| Explicit Period PV Total | — | — | — | 1,142.4 |
| Terminal Value | g = 3% | 5,912.2 | 0.650 | 3,841.5 |
| Operating Business Equity Value | — | — | — | 4,983.9 |
Adding Non-Operating Assets
| Component | Value (RMB bn) | Basis |
|---|---|---|
| Operating Business DCF | 4,983.9 | FCFE model above |
| (+) Net Cash | 27.4 | Broad cash of RMB 433.8bn minus interest-bearing debt of RMB 406.4bn |
| (+) Investment Portfolio, 50% discount | 456.9 | Total investment portfolio of approximately RMB 913.8bn, conservatively haircut by 50% |
| Total Equity Value | 5,468.2 | Operating business value plus net cash and discounted investment portfolio |
| Per Share (RMB) | 605 | Divided by approximately 9.037bn shares |
| Per Share (HKD) | ~HK$658 | Based on the RMB/HKD exchange-rate assumption used in this framework |
Sensitivity Matrix: Cost of Equity vs. Terminal Growth
The base case of Ke = 9% and terminal growth = 3% produces approximately HK$658 per share. The broader sensitivity range is more important than the base case alone:
| Ke \ g | 2.0% | 2.5% | 3.0% | 3.5% | 4.0% |
|---|---|---|---|---|---|
| 8.0% | 679 | 725 | 780 | 848 | 932 |
| 8.5% | 630 | 668 | 713 | 768 | 834 |
| 9.0% | 588 | 620 | 658 | 702 | 756 |
| 9.5% | 552 | 579 | 611 | 648 | 691 |
| 10.0% | 520 | 543 | 570 | 602 | 638 |
Three Observations from the DCF
First, the base case value of approximately HK$658 per share is materially above the reference market price of approximately HK$453 at the time of writing. This result is derived from the core operating businesses and assigns no explicit monetization value to AI.
Second, even the conservative matrix case of Ke = 10% and terminal growth of 2% produces approximately HK$520 per share. This does not mean downside risk is absent. It means that under the assumptions used here, the core business appears to support a valuation above the reference price even before explicit AI value is added.
Third, the primary sensitivity driver is the discount rate. A higher geopolitical or regulatory risk premium can reduce value materially. This is why the margin-of-safety discussion should be framed as scenario-based, not definitive.
Probability-Weighted Scenario Analysis
The following scenario framework provides an additional cross-check against the DCF:
| Scenario | Assumptions | Implied Value | Probability |
|---|---|---|---|
| Optimistic |
New business 2027 revenue: RMB 800bn Traditional business net profit: RMB 240bn Total net profit: RMB 400bn Valuation applied: 20× P/E |
RMB 8.0T +129% |
15% |
| Base Case |
New business 2027 revenue: RMB 500bn Traditional business net profit: RMB 230bn Total net profit: RMB 305bn Valuation applied: 16× P/E |
RMB 4.88T +40% |
75% |
| Pessimistic |
New business 2027 revenue: ~0 Traditional business net profit: RMB 200bn Total net profit: RMB 200bn Valuation applied: 1.5× P/B |
RMB 2.25T −36% |
10% |
Probability-weighted expected market capitalization:
(8.0 × 15%) + (4.88 × 75%) + (2.25 × 10%) = RMB 5.085 trillion, approximately 45% above the reference market capitalization of RMB 3.5 trillion.
The pessimistic scenario deserves attention because it defines the downside case. It assumes AI investment produces no meaningful commercial return, Video Accounts growth stalls, and the market re-rates Tencent toward 1.5× P/B. This is possible, but it would require a combination of business disappointment, multiple compression, and sustained risk premium.
The point is not that the pessimistic case is impossible. The point is that the current valuation appears to assign limited explicit value to Tencent’s AI option under the assumptions used in this framework.
Balance Sheet Health and Interest Rate Cross-Verification
Treasury Spread as a Sanity Check
Most investors treat corporate cash as a passive asset — a buffer against adversity. Tencent’s treasury structure suggests something more active.
In 2025, Tencent earned an effective yield of approximately 4.10% on broad monetary assets, while its effective borrowing rate was approximately 3.95%. This creates a modest positive net interest spread of roughly 15 basis points.
This does not turn Tencent into a financial company, nor should it be overstated. But it does provide a useful cross-check: the balance sheet is not merely large; it appears to be managed in a way that reduces the drag from holding substantial liquidity.
| Metric | 2025 Value | Derivation |
|---|---|---|
| Interest Income | RMB 16.9bn | Annual report disclosure |
| Average Broad Monetary Assets | ~RMB 416.1bn | Average of estimated 2024 year-end and 2025 year-end broad monetary assets |
| Effective Yield on Cash | ~4.10% | 16.9 / 416.1 |
| Financing Costs | RMB 15.1bn | Annual report disclosure |
| Average Interest-Bearing Debt | ~RMB 381.8bn | Average of 2024 and 2025 interest-bearing debt |
| Effective Borrowing Rate | ~3.95% | 15.1 / 381.8 |
| Net Interest Spread | +15 bps | 4.10% − 3.95% |
| Net Cash Position | RMB 27.4bn | Broad cash of RMB 433.8bn minus interest-bearing debt of RMB 406.4bn |
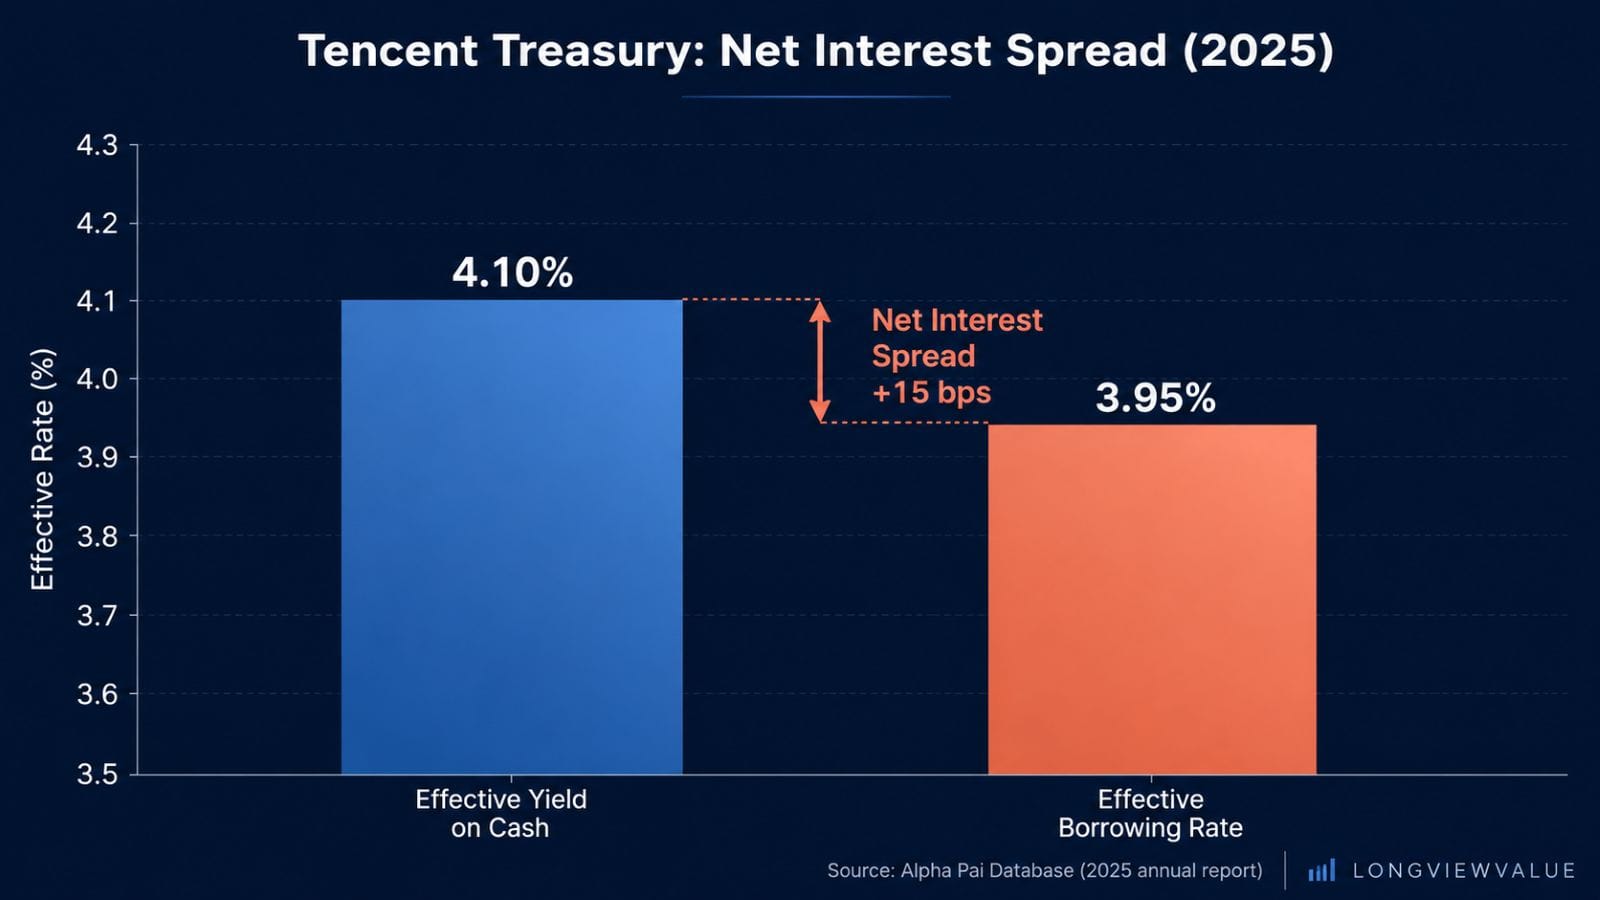
Tencent’s 2025 effective yield on broad monetary assets modestly exceeded its effective borrowing rate, producing a positive spread of approximately 15 basis points.
What the Spread Suggests
The 4.10% effective yield on cash is notable relative to basic deposit rates. It suggests that Tencent’s treasury function uses structured deposits, money-market instruments, and short-duration fixed-income products rather than leaving cash entirely idle.
The 3.95% borrowing rate is also informative. For a private-sector Chinese technology company, that rate suggests a strong credit profile and access to relatively low-cost funding. Tencent’s interest-bearing debt of RMB 406.4 billion is predominantly long-term, reducing near-term refinancing pressure.
The spread is not central to the investment thesis. But it supports a narrower conclusion: Tencent’s balance sheet appears to be actively managed, and its liquidity position is not a material drag on the valuation base.
ROCE Confirmation
The balance sheet analysis is further supported by Tencent’s 2025 ROCE calculation:
| Metric | 2025 Value |
|---|---|
| EBIT | RMB 263.7bn |
| Current Assets | RMB 595.5bn |
| Current Liabilities | RMB 412.8bn |
| Net Cash | RMB 27.3bn |
| Fixed Assets | RMB 200.2bn |
| Capital Employed | RMB 355.6bn |
| ROCE | 74.2% |
A ROCE of 74.2% reflects the economics of a platform business with relatively limited physical capital needs. Gaming titles, social infrastructure, advertising systems, and payment networks can generate substantial operating profit without requiring proportional increases in tangible capital.
This ROCE figure is also a useful cross-check on the DCF. A high-ROCE business can fund growth internally, generate surplus cash, and return capital without requiring large external financing. Part 4’s owner earnings analysis supports the same conclusion: Tencent’s conservative Owner Earnings proxy reached approximately 95.2% of net income in 2025.
Shareholder Return Architecture
The balance sheet supports a significant shareholder return program.
In 2025, Tencent repurchased approximately RMB 73.4 billion of its shares, compared with cash dividends of approximately RMB 41.9 billion. The current capital-return architecture therefore remains buyback-heavy and dividend-stable.
The logic for prioritizing buybacks is reasonable if management believes the shares trade below conservative intrinsic value. At a P/B of approximately 3.24× against a decade median of roughly 6.5×, repurchases may be accretive to remaining shareholders. But P/B alone is not enough. The buyback case depends on a broader judgment about FCF durability, owner earnings quality, intrinsic value, and future AI capital intensity.
Conclusion: Four Methods, One Direction
No valuation method is infallible.
P/B analysis can overstate asset support if ROE deteriorates. SOTP can overstate value if the parts cannot be realized. DCF is sensitive to discount rate and terminal growth. Owner earnings can be overstated if expansionary capital later becomes maintenance capital.
That is why cross-verification matters.
The four methodologies used in this chapter do not produce identical answers. They do, however, point in a similar direction under the assumptions used:
The central DCF range of approximately HK$520–780 per share sits above the reference market price of approximately HK$453 at the time of writing. The SOTP base case of approximately HK$715 and the P/B recovery reference points are broadly consistent with this range.
The conclusion is not that Tencent has a precise intrinsic value. It does not. The conclusion is that multiple valuation lenses, using different assumptions, point toward a material valuation gap under conservative assumptions.
What the Market May Be Pricing
The current valuation may reflect one or more of the following assumptions:
- Tencent’s ROE will structurally revert toward its cost of equity;
- geopolitical, regulatory, and VIE-structure risks deserve a permanently higher discount rate;
- AI CAPEX will become a recurring cost of competition rather than a source of value creation;
- the market is not yet fully reflecting the earnings recovery and cash-generation durability since 2023.
The evidence is mixed but important. ROE has recovered above 20%. FCF reached RMB 182.6 billion in 2025. Gaming-license normalization has reduced one major regulatory overhang. Video Accounts remains under-monetized relative to short-video peers. Hunyuan and WeChat AI Agent development create optionality, though not yet a proven earnings stream.
Scenario (2) is a real risk that each investor must judge independently. Scenario (3) is especially important: if AI infrastructure becomes a permanent maintenance cost, the valuation base should be lower. Scenario (4) is the source of potential opportunity.
The AI Option: Limited Explicit Value in the Current Framework
The valuation work above does not require AI monetization to succeed.
The DCF model excludes explicit AI revenue contribution. The conservative SOTP case assigns zero AI option value. The P/B analysis does not assume AI-driven ROE expansion.
Under these assumptions, Tencent’s current valuation appears to assign limited explicit value to the AI option. That does not mean the AI option is risk-free or literally free. It means the core business appears to support a significant portion of the valuation range before giving credit to AI monetization.
That distinction matters.
The key investment question is not simply whether Tencent can build powerful AI models. It is whether Tencent can convert AI capability into distribution, execution, transactions, cloud demand, advertising efficiency, and ultimately incremental free cash flow.
Margin of Safety, With Conditions
Graham’s margin of safety is not a single number. It is a structural condition: a gap between price and conservatively estimated value, wide enough to absorb analytical error.
This chapter identifies a scenario-based margin of safety, not a definitive one.
The downside scenario — a return toward the 2.4× P/B trough — implies meaningful downside from the reference price. The base case across SOTP, DCF, and P/B recovery scenarios implies material upside. The resulting asymmetry appears favorable under the assumptions used, but it is not immune to risk.
The key risks are clear:
- discount rate expansion from geopolitical, regulatory, or VIE-structure concerns;
- AI CAPEX becoming a permanent maintenance burden;
- weaker-than-expected monetization of Video Accounts and AI applications;
- deterioration in gaming, advertising, or FinTech growth;
- investment portfolio markdowns;
- terminal-growth assumptions proving too optimistic.
The strength of the Tencent valuation case is not that any one model is decisive. It is that P/B, SOTP, DCF, and owner earnings quality each point toward a similar conclusion: Tencent’s core business and asset base appear to support a valuation range above the reference market price, while AI optionality is not required for the base valuation case to work.
That is a more durable conclusion than a single target price.
It is also the appropriate place to end the Tencent series: not with certainty, but with a disciplined range of value, a clear set of assumptions, and an explicit understanding of the risks that could make the analysis wrong.
LongViewValue Tencent Research Series
This article is Part 5 — and the conclusion — of the LongViewValue Tencent Research Series, a systematic multi-part analysis of Tencent Holdings (0700.HK) through the framework of quality value investing.
→ Part 1: The Investment Thesis — WeChat, Capital Discipline, and the AI Option
→ Part 2: The Economic Moat — How Tencent's Social Graph Creates Durable Competitive Advantage
→ Part 3: AI Strategy, Value Capture, and the Agent Era
→ Part 4: Capital Allocation and Owner Earnings
→ Part 5: Valuation and Margin of Safety — This article
This chapter concludes the LongViewValue Tencent Research Series. The series began with the investment thesis, moved through moat, AI strategy, and capital allocation, and ends here with a valuation framework. The purpose has not been to predict a single market price, but to understand the business, the cash flows, the risks, and the range of intrinsic value under explicit assumptions.
Disclosure & Disclaimer
This article is a personal research note for educational and informational purposes only, based on publicly available information. It does not constitute investment advice, securities recommendation, or a solicitation to buy or sell any security.
The author is not a licensed securities analyst or registered investment adviser. All analyses, valuation ranges, scenario estimates, and opinions are the author’s personal views and may contain errors or omissions.
All valuation ranges in this article are scenario-based analytical estimates derived from stated assumptions. They are not price targets. Actual outcomes may differ materially due to business performance, regulation, geopolitical risk, market conditions, exchange-rate movements, discount-rate changes, or errors in the assumptions used.
Readers should conduct their own independent research and consult licensed professionals before making investment decisions. Investing involves risk, including the risk of permanent capital loss. Past performance does not guarantee future results.
The author may hold positions in the securities discussed.